My Master Thesis project
Thesis title:
Residential Flood Risk Mapping Based on Social Vulnerability Weighted by Analytical Hierarchy Process and Machine Learning Methods
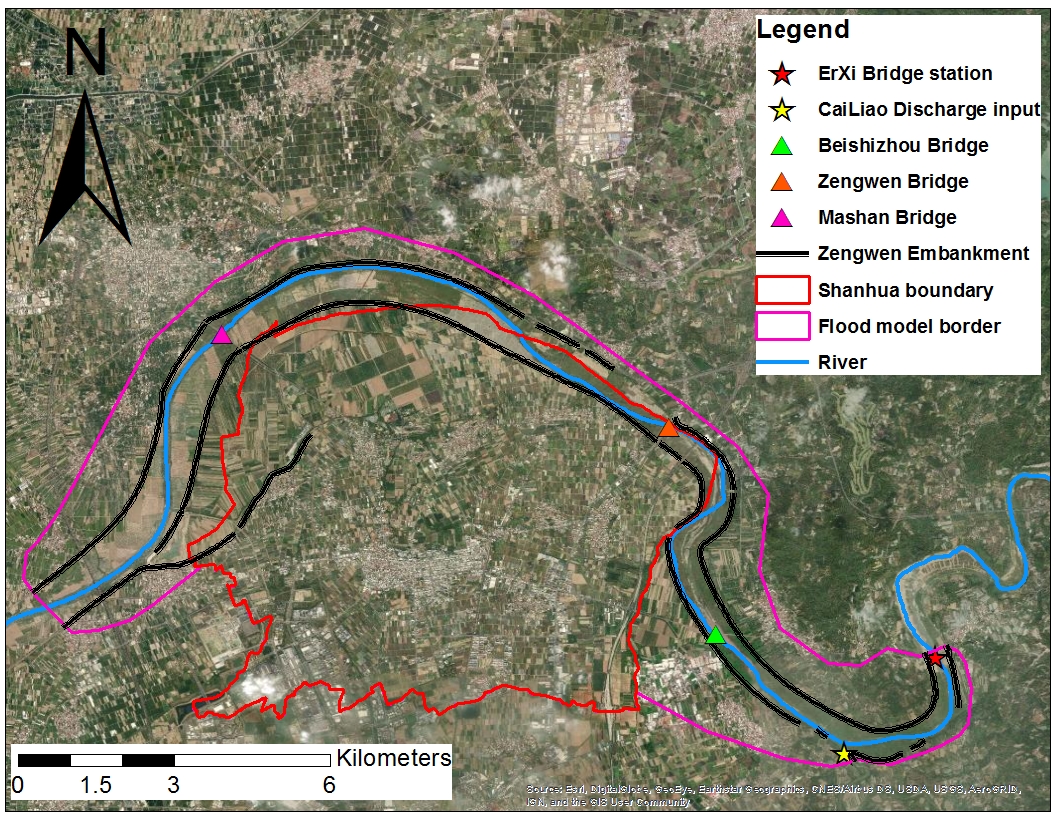
Flood risk maps are important tools for state government authorities to provide residents with information about potential flooding hazards. This study aimed to develop a flood risk map by combining vulnerability and hazard maps. The influence of different return-period discharges, vulnerability resolutions, and vulnerability weightings on the final risk assessment of individual buildings was investigated in the Shanhua District, located in Tainan City.
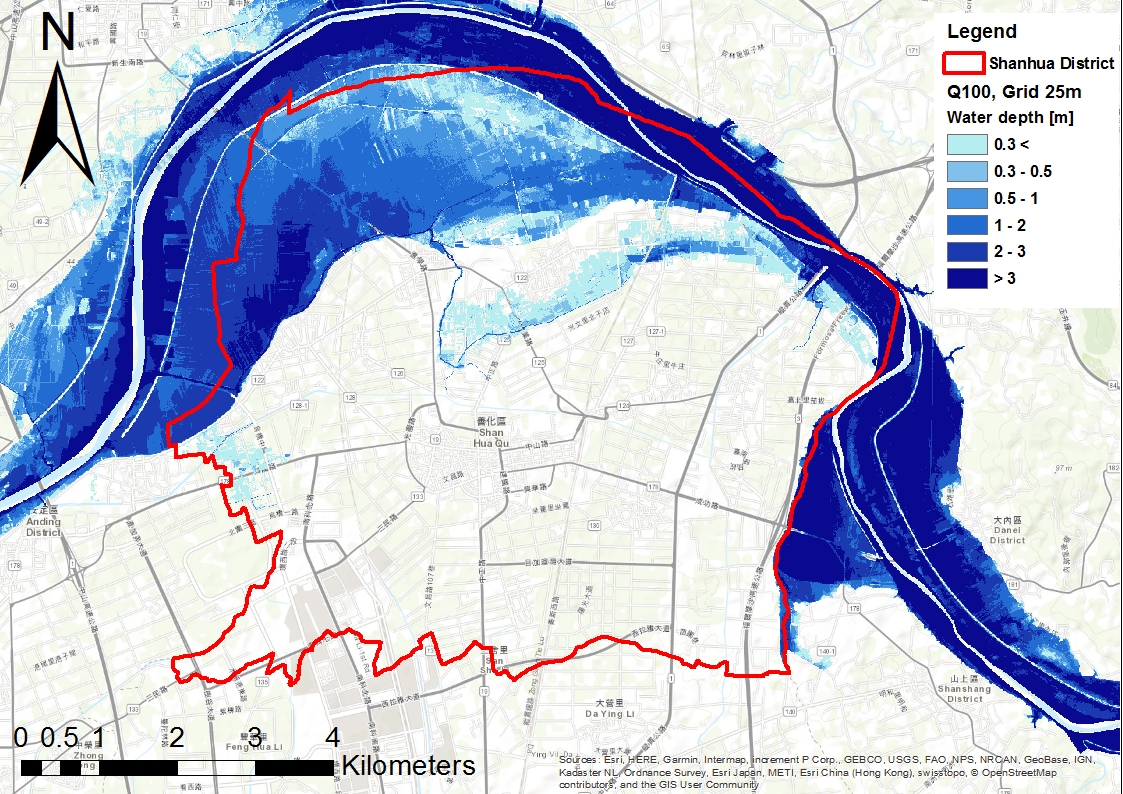
Figure 1: Study Area
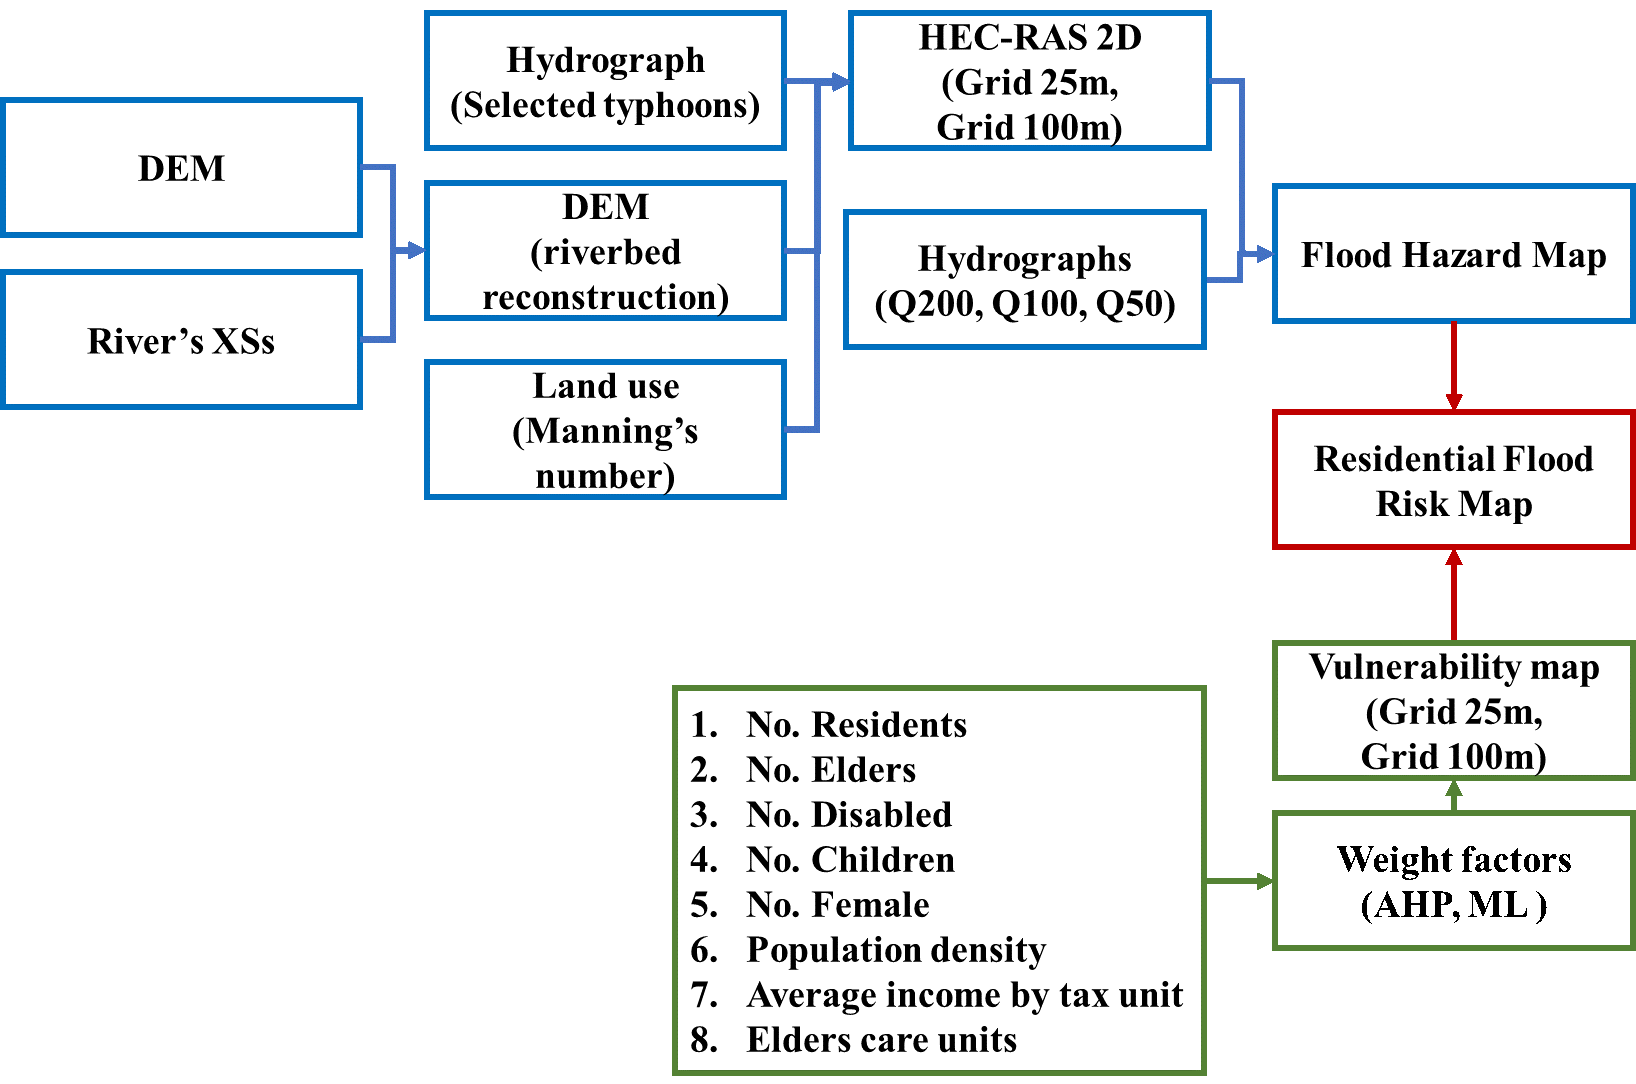
Flood Hazard:
The fluvial flood hazard component was based on simulated water depths generated by the HEC-RAS 2D hydraulic model (using the diffusion wave approximation).
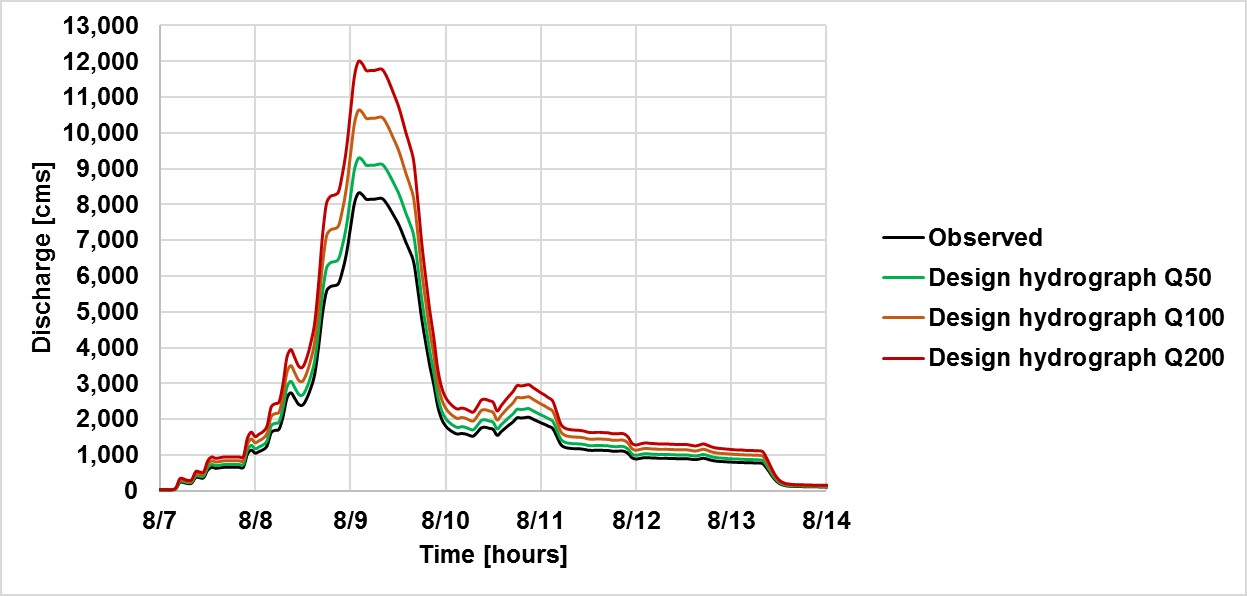
Flood peaks for return periods of 50, 100, and 200 years at the upstream bridge station were 9,280, 10,630, and 12,000 m³/s, respectively, as obtained from the local Water Resources Agency analysis.
Designed hydrographs were prepared based on information from the United Nations-SPIDER advisory portal (United Nations, 2020).
Observed flood event hydrographs and corresponding return periods were used for the calculations.
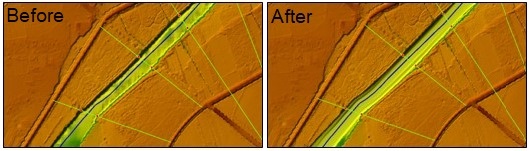
Riverbed elevation reconstruction in the digital elevation model (DEM) was performed during preprocessing in HEC-RAS, as the original DEM was derived from LiDAR, which cannot penetrate the water surface.
To determine the appropriate Manning’s n for the river channel, the HEC-RAS 2D model was calibrated using upstream discharges from five typhoons, based on downstream discharge measurements.
The exported water depth raster, originally at a 5m spatial resolution, was later resampled to 25m and 100 m resolutions.
Figure 2: DEM before and after river bed reconstruction.
Figure 3: Designed hydrographs
Figure 4: Q100 RP flood hazard map
Flood vulnerability:
Three different vulnerability weightings were applied to generate flood vulnerability maps.
Two machine learning models—classification and regression tree (CART) and random forest (RF)—were used to calculate feature importance in this study.
The machine learning results were compared with the weighted importance obtained from an Analytical Hierarchy Process (AHP) procedure for performance evaluation, with a total of 16 respondents participating in the survey.
Vulnerability indices were selected based on a literature review and the availability of data in the study area.
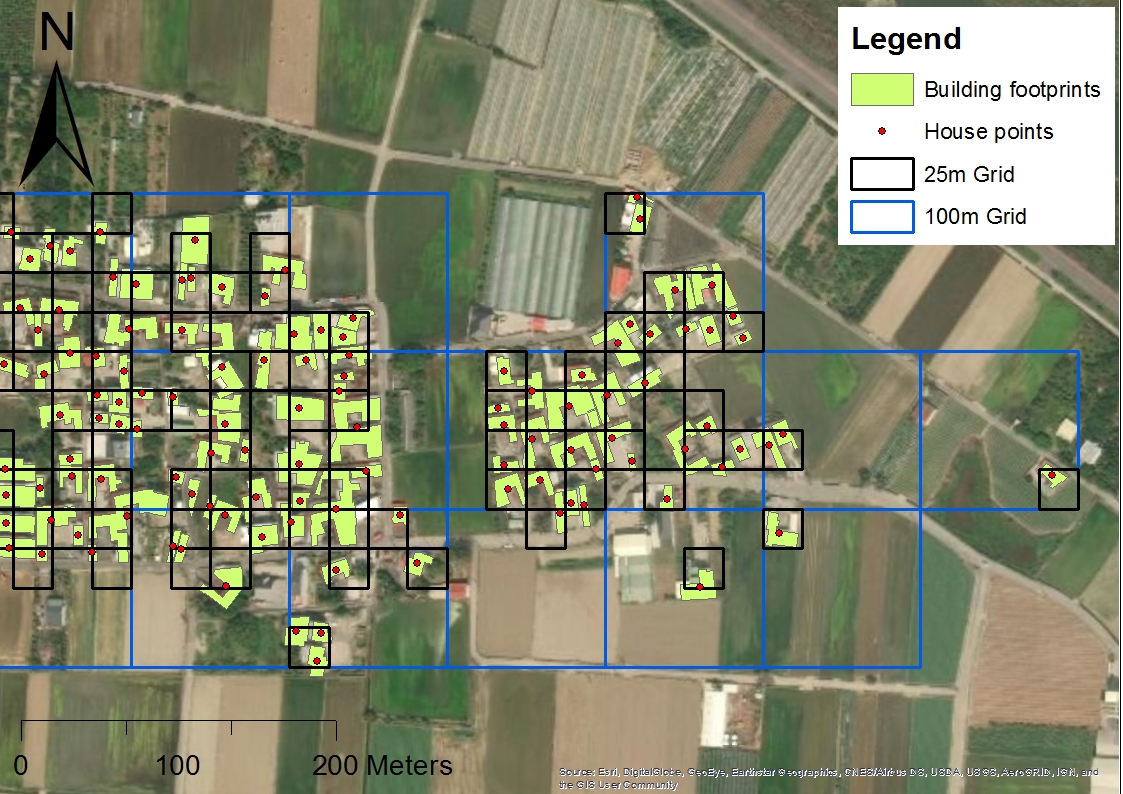
Flood vulnerability maps were also produced at two different spatial resolutions, 20m and 100m, based on the locations of houses.
Figure 5: Households data transfered to 25m and 100m grids.
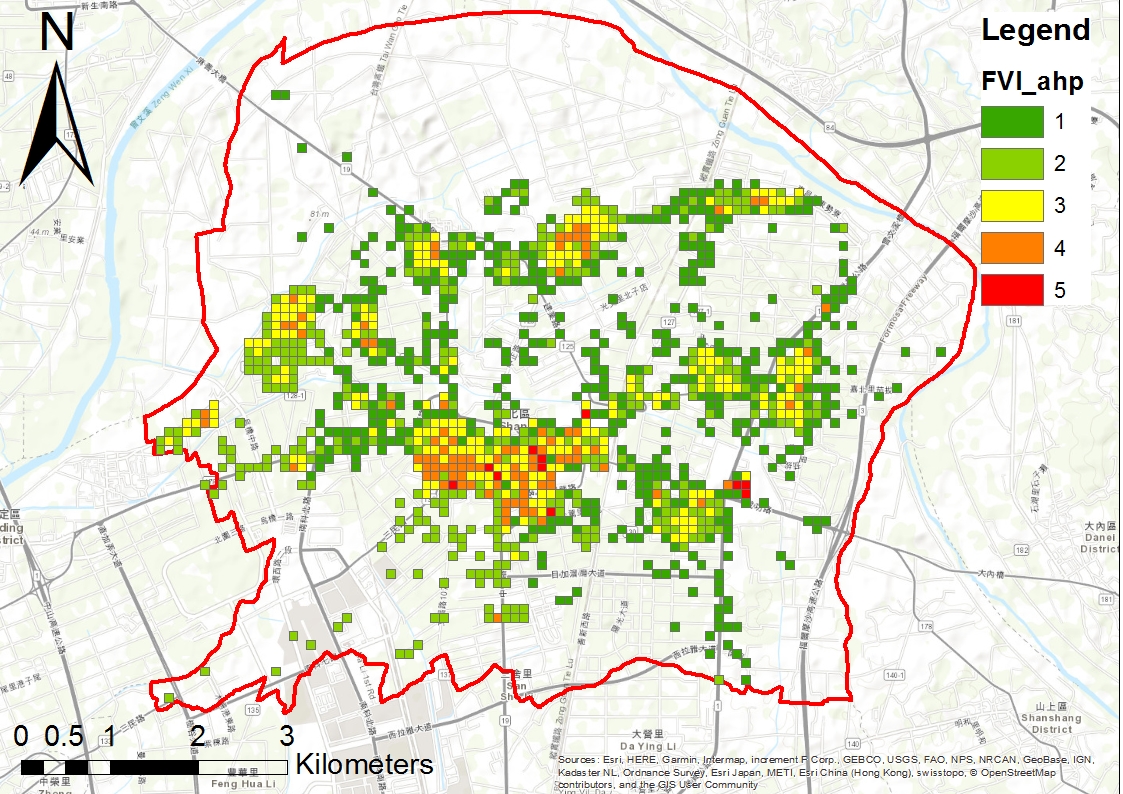
Figure 6: Flood vulnerability from AHP in 100m resolution
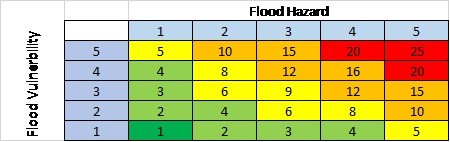
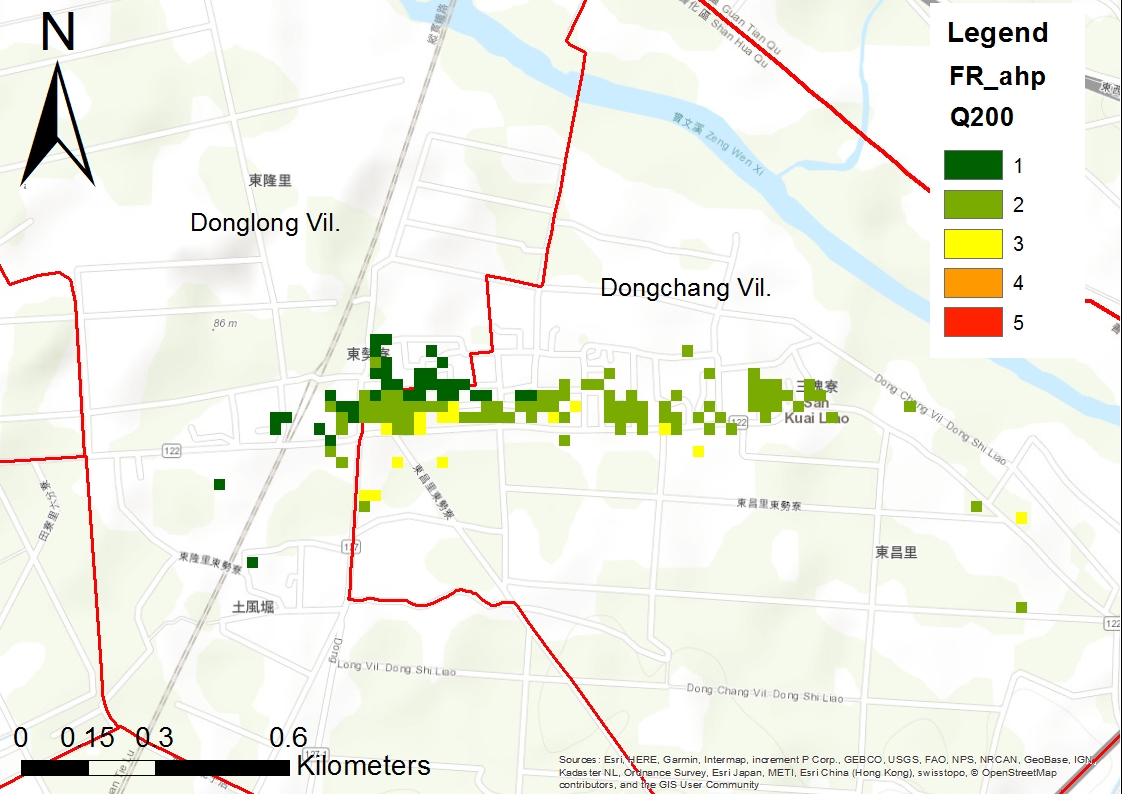
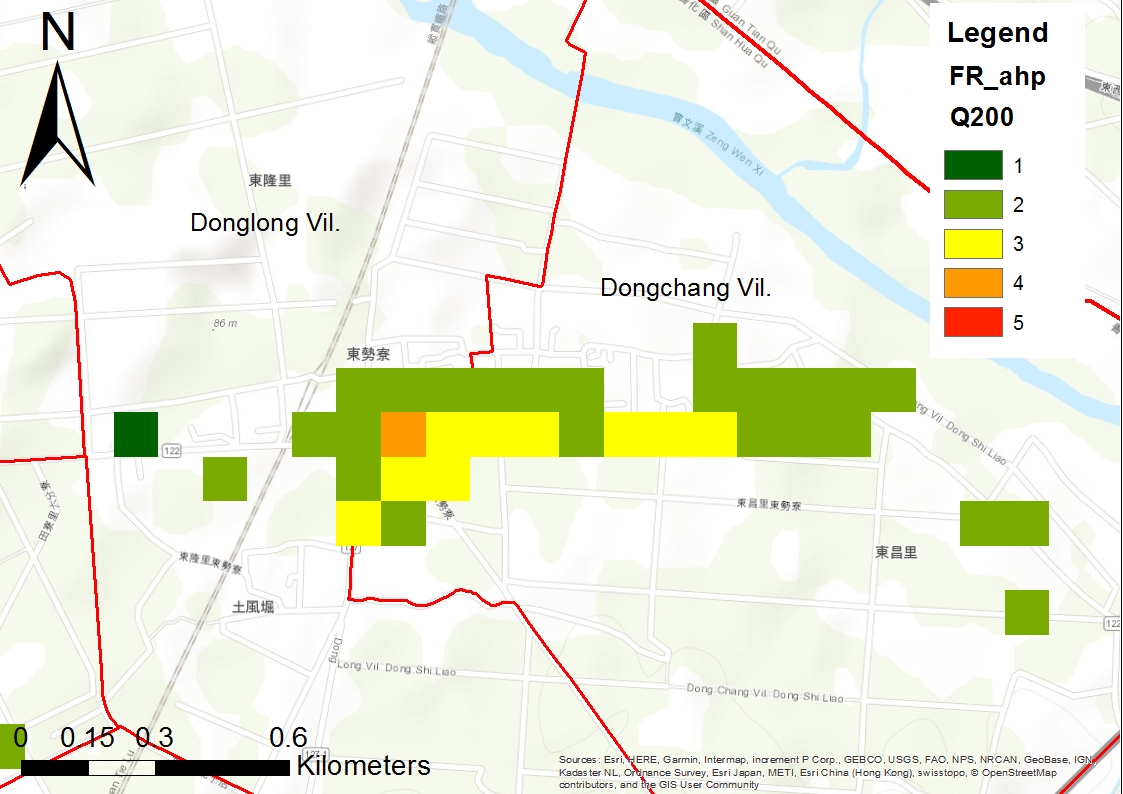
Flood risk:
In total, 30 different flood risk maps were generated, covering various flood vulnerability methods, vulnerability resolutions, and flood model resolutions.
Figure 8: Flood risk of Q200 RP in 25m
Figure 9: Flood risk of Q200 RP in 100m
Findings:
First, findings from the vulnerability maps indicated that the CART model tended to slightly overestimate, whereas the RF model tended to substantially overestimate the AHP results.
Second, the vulnerability resolution had a much larger impact, as coarser resolutions included more households.
Lastly, finer flood model resolutions provided more precise results in urban areas and captured more extensive risk zones.
Data sources:
- Central Weather Bureau, Taiwan
- Shanhua Household Registration Office
- Water Resources Agency, Taiwan
- National Science and Technology Center for Disaster Reduction, Taiwan