Year:2022
QGIS
Python
Urban green mapping
Year:2022
QGIS
Python
Description
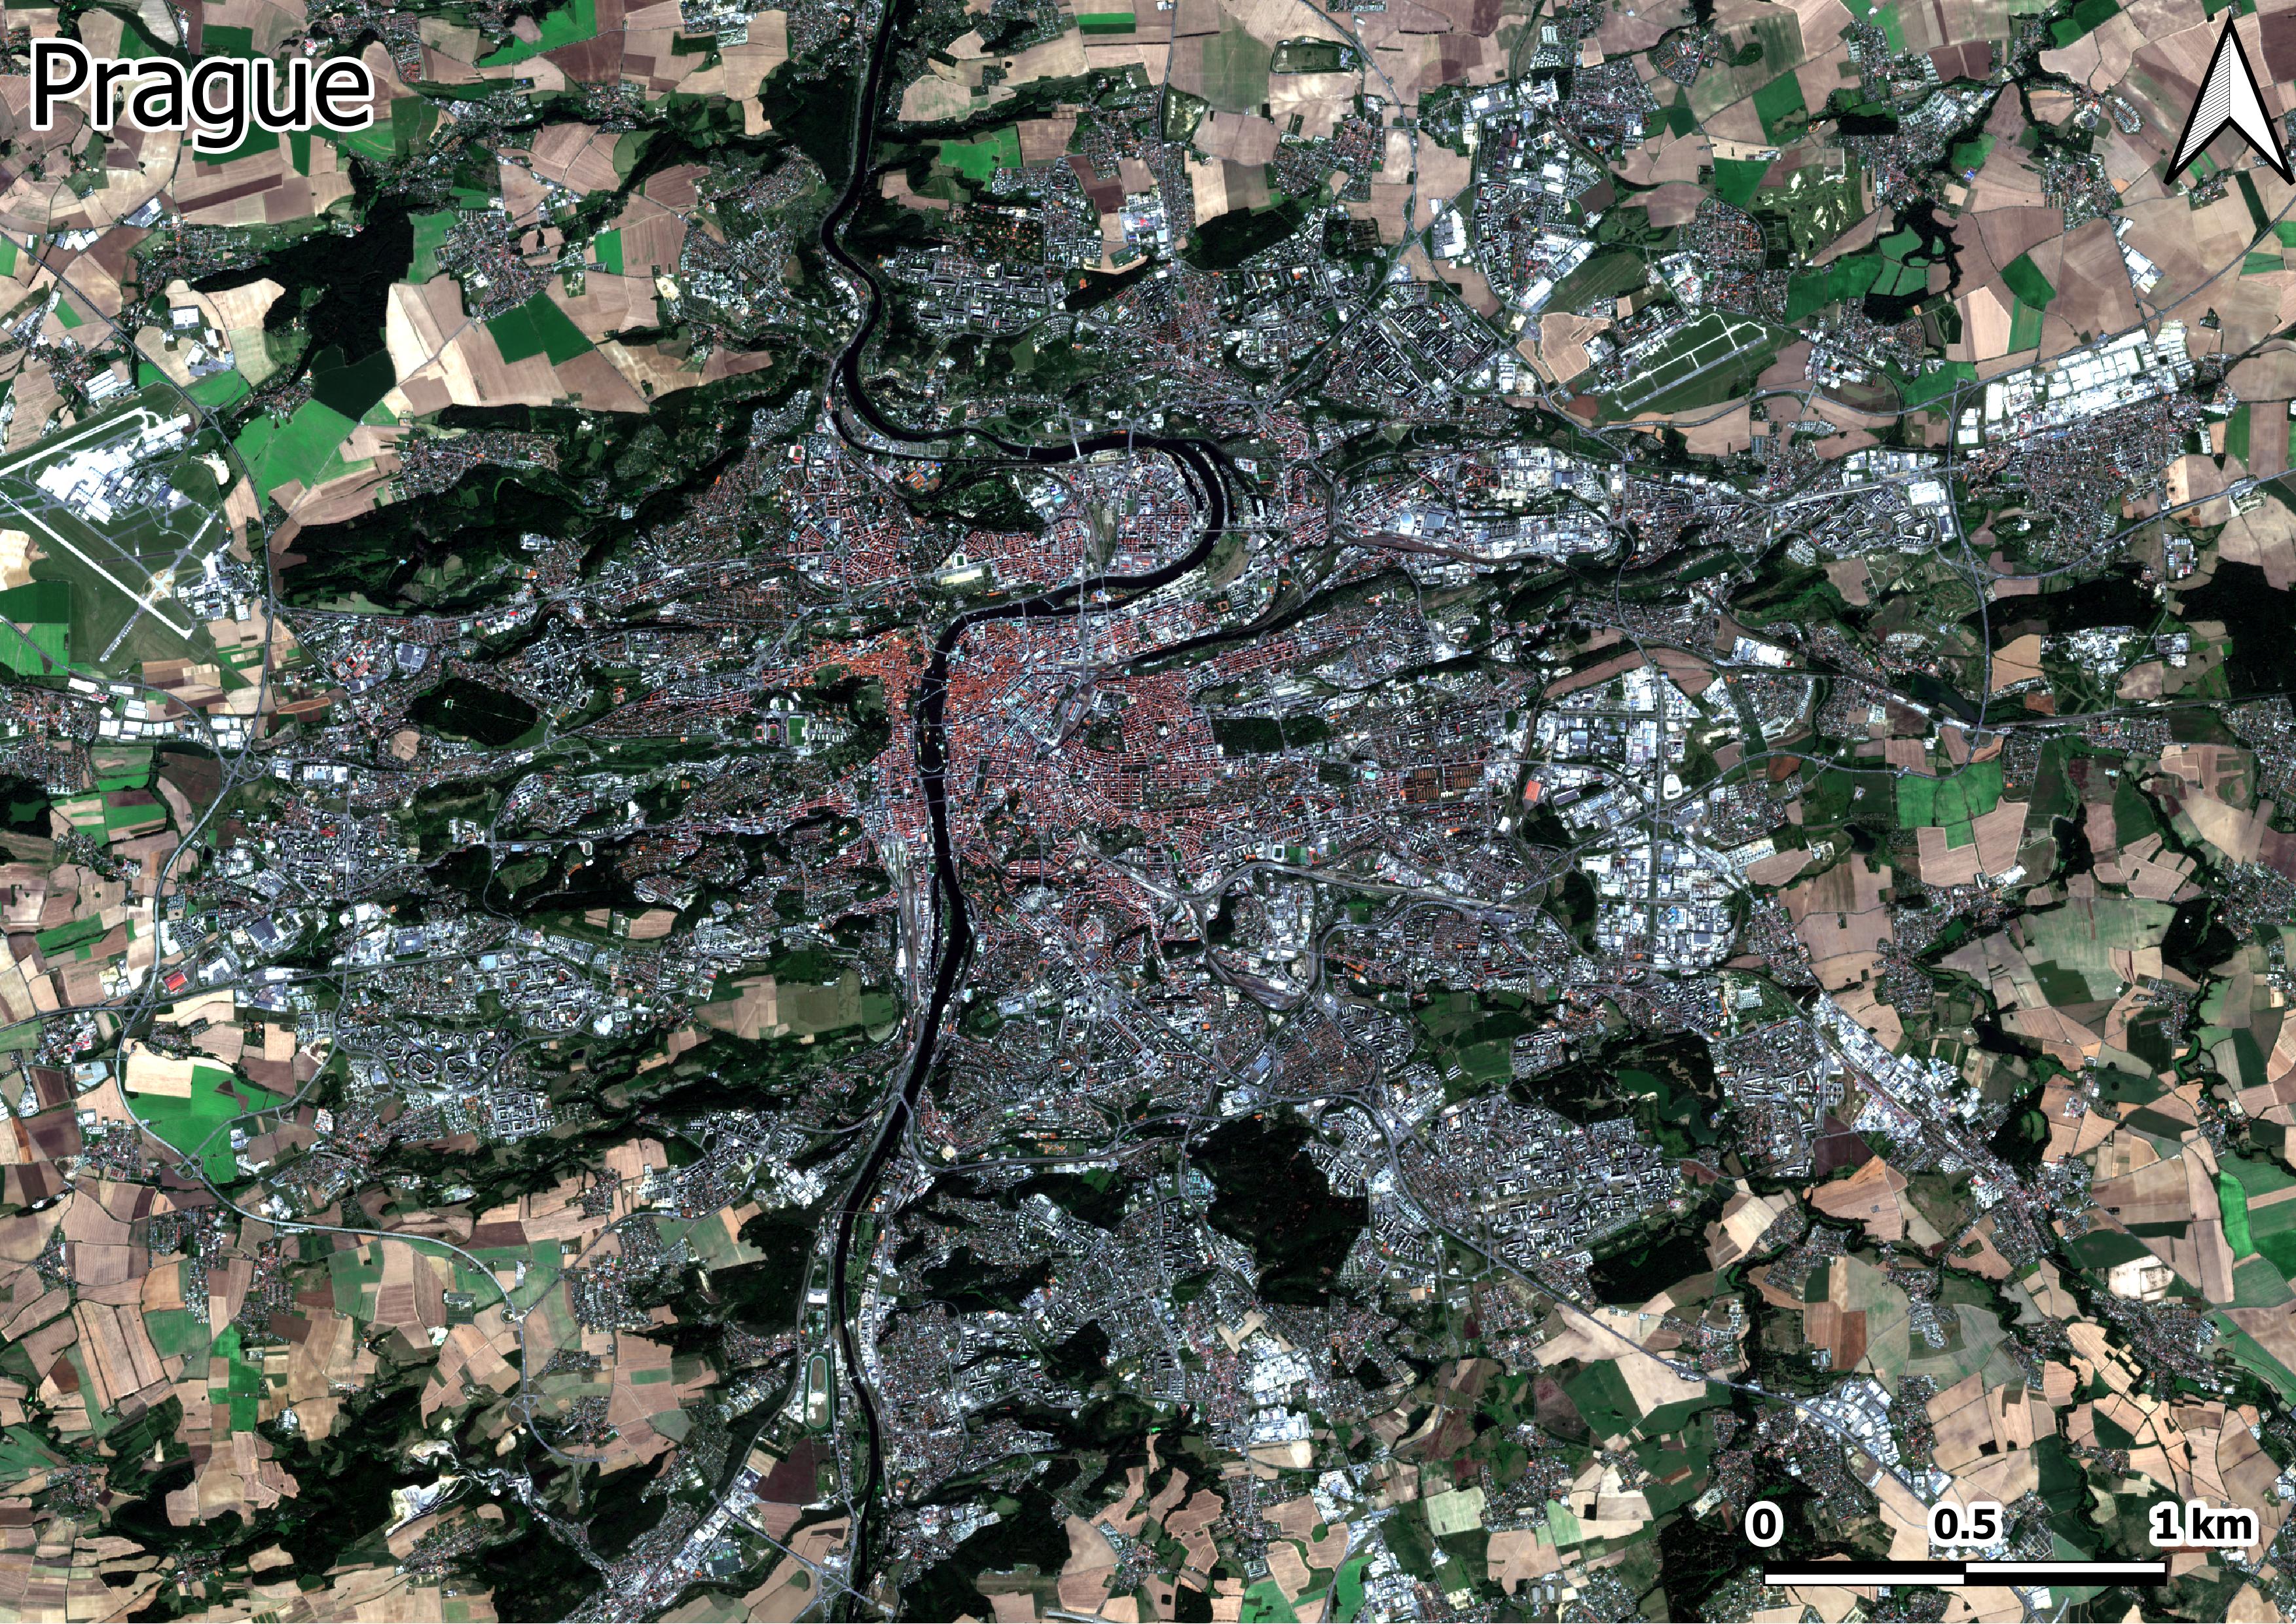
In 2019, the city of Prague (capital of the Czech Republic) set a goal of planting one million trees within eight years on its territory.
Details can be found at zastromujprahu.cz and adaptacepraha.cz.
Out of curiosity, I aim to map how the total percentage of urban green areas has changed since this policy was implemented.
Satellite observations are ideal for this task, as it is very similar to land-use change mapping.
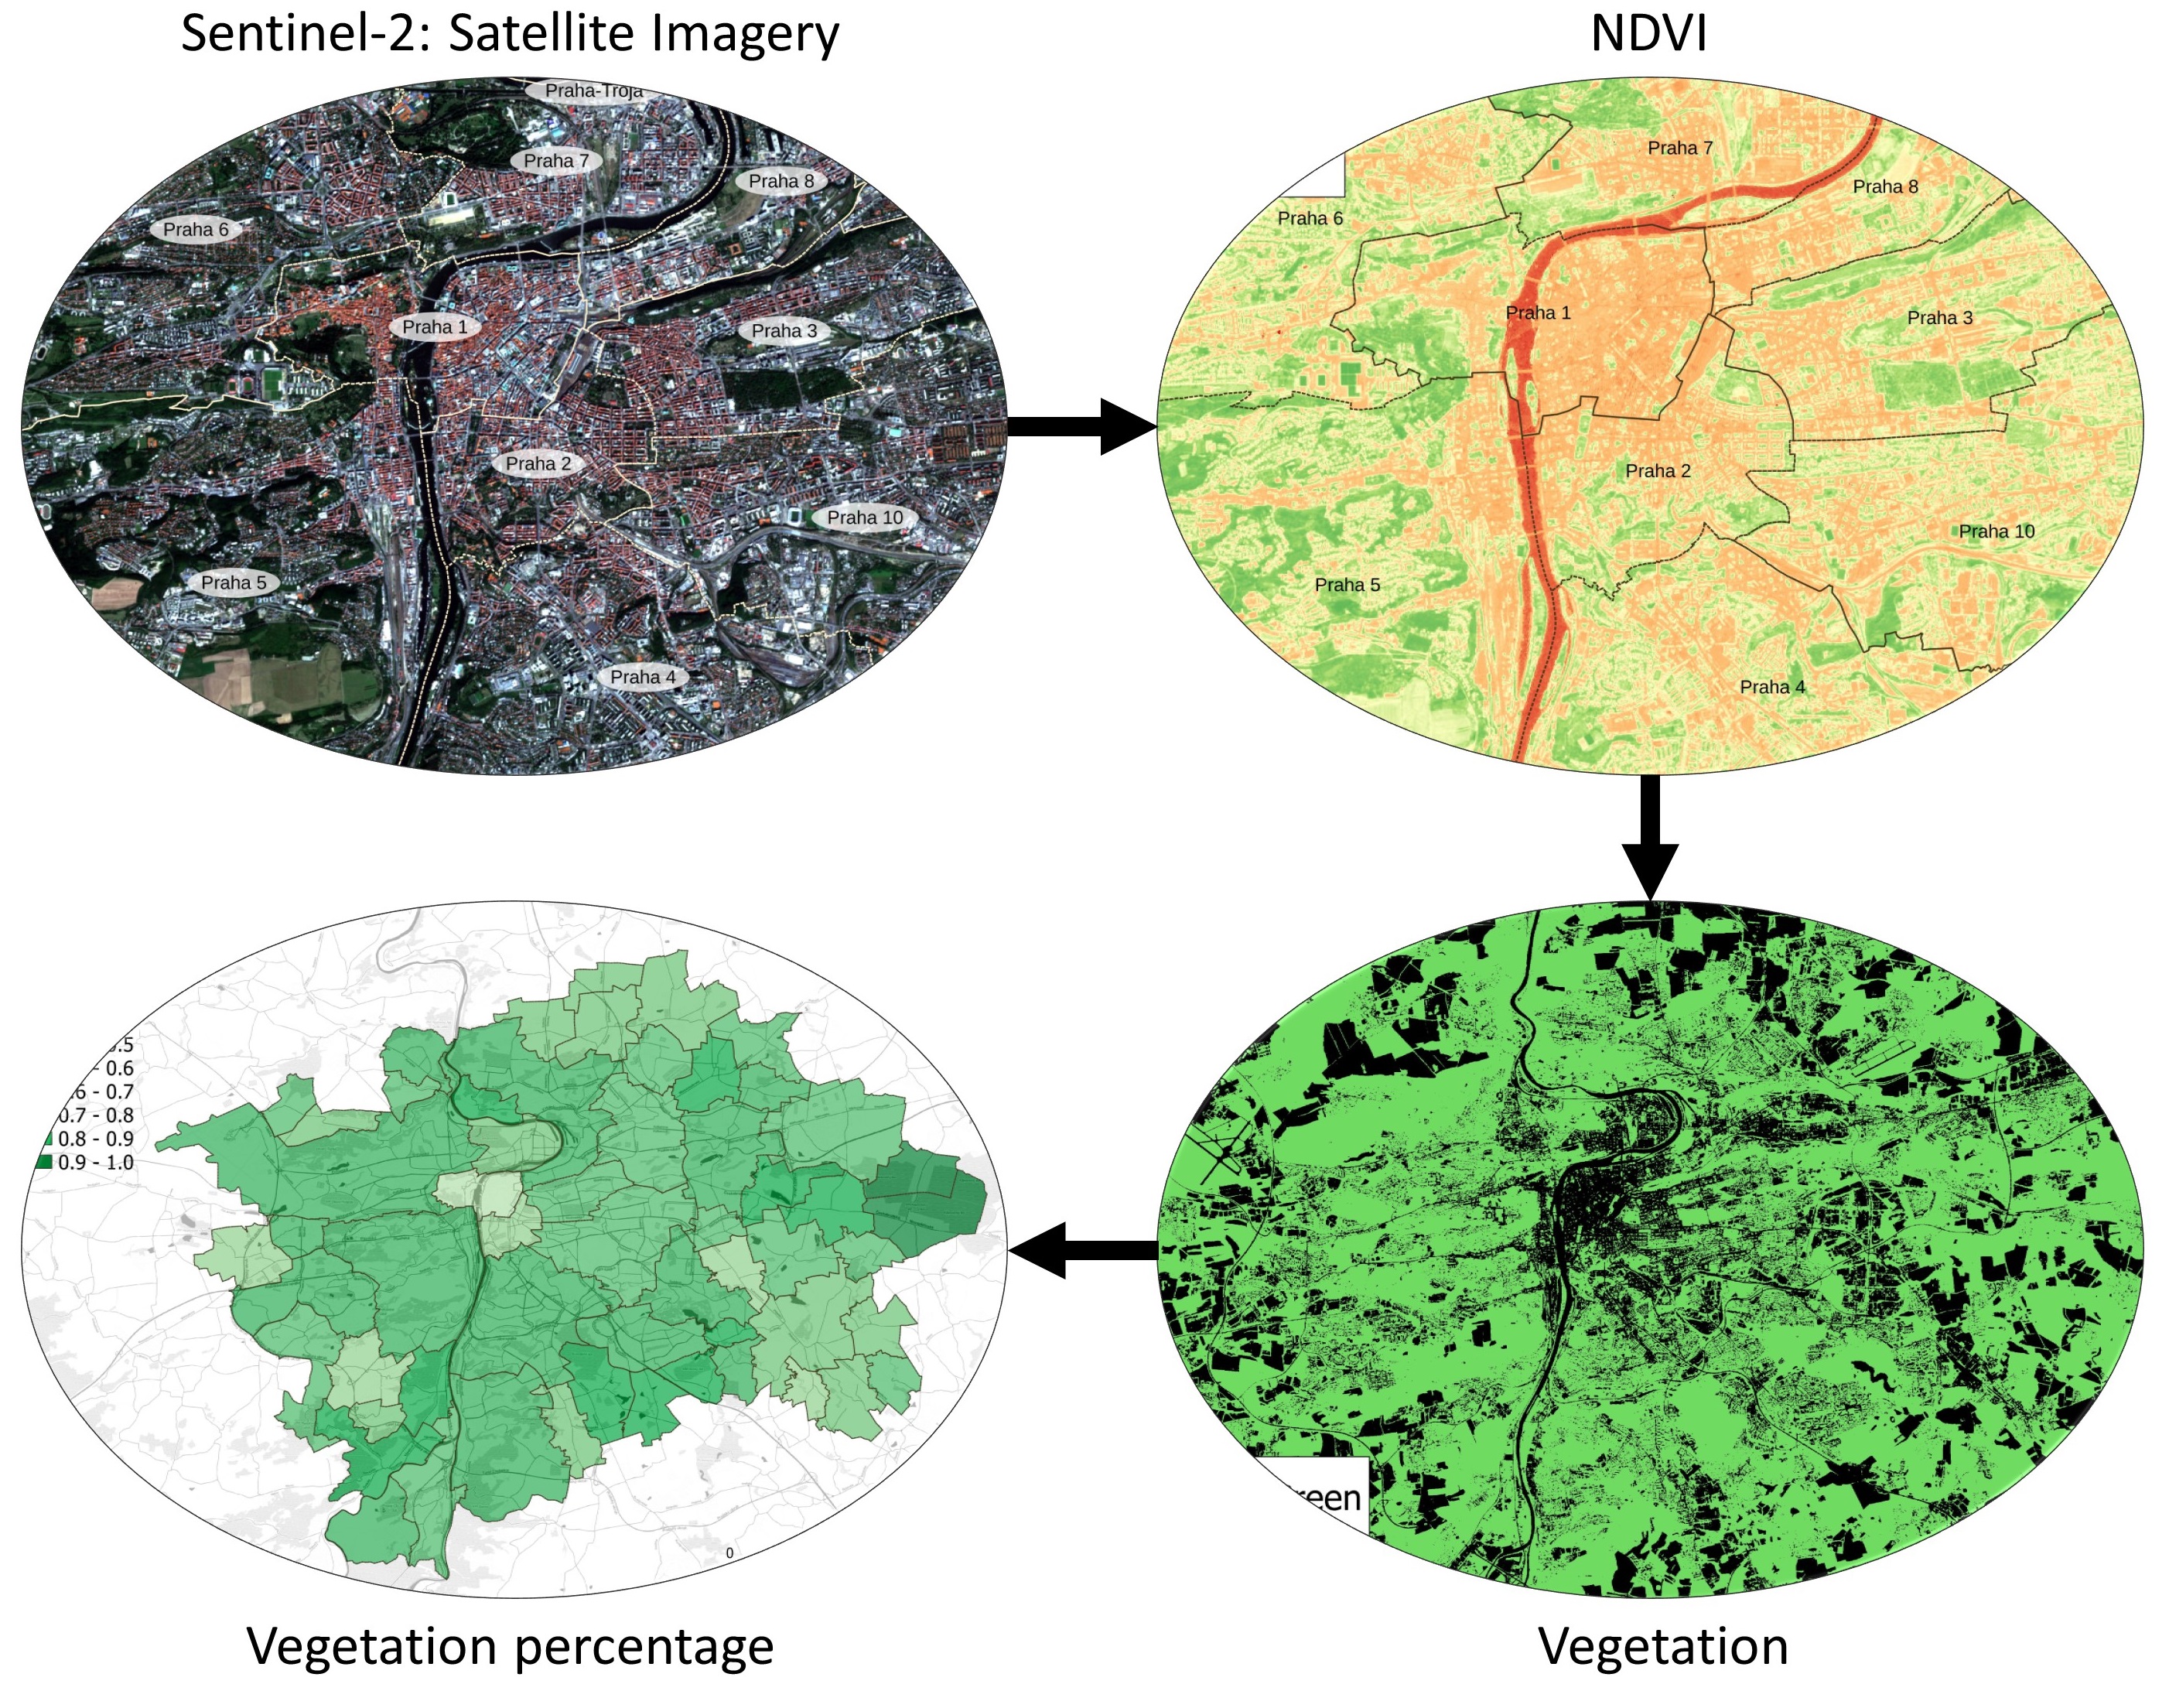
Alternatively, a simpler approach based on the normalized difference vegetation index (NDVI) can be used. This method utilizes Sentinel-2 satellite imagery.
1.) Download:
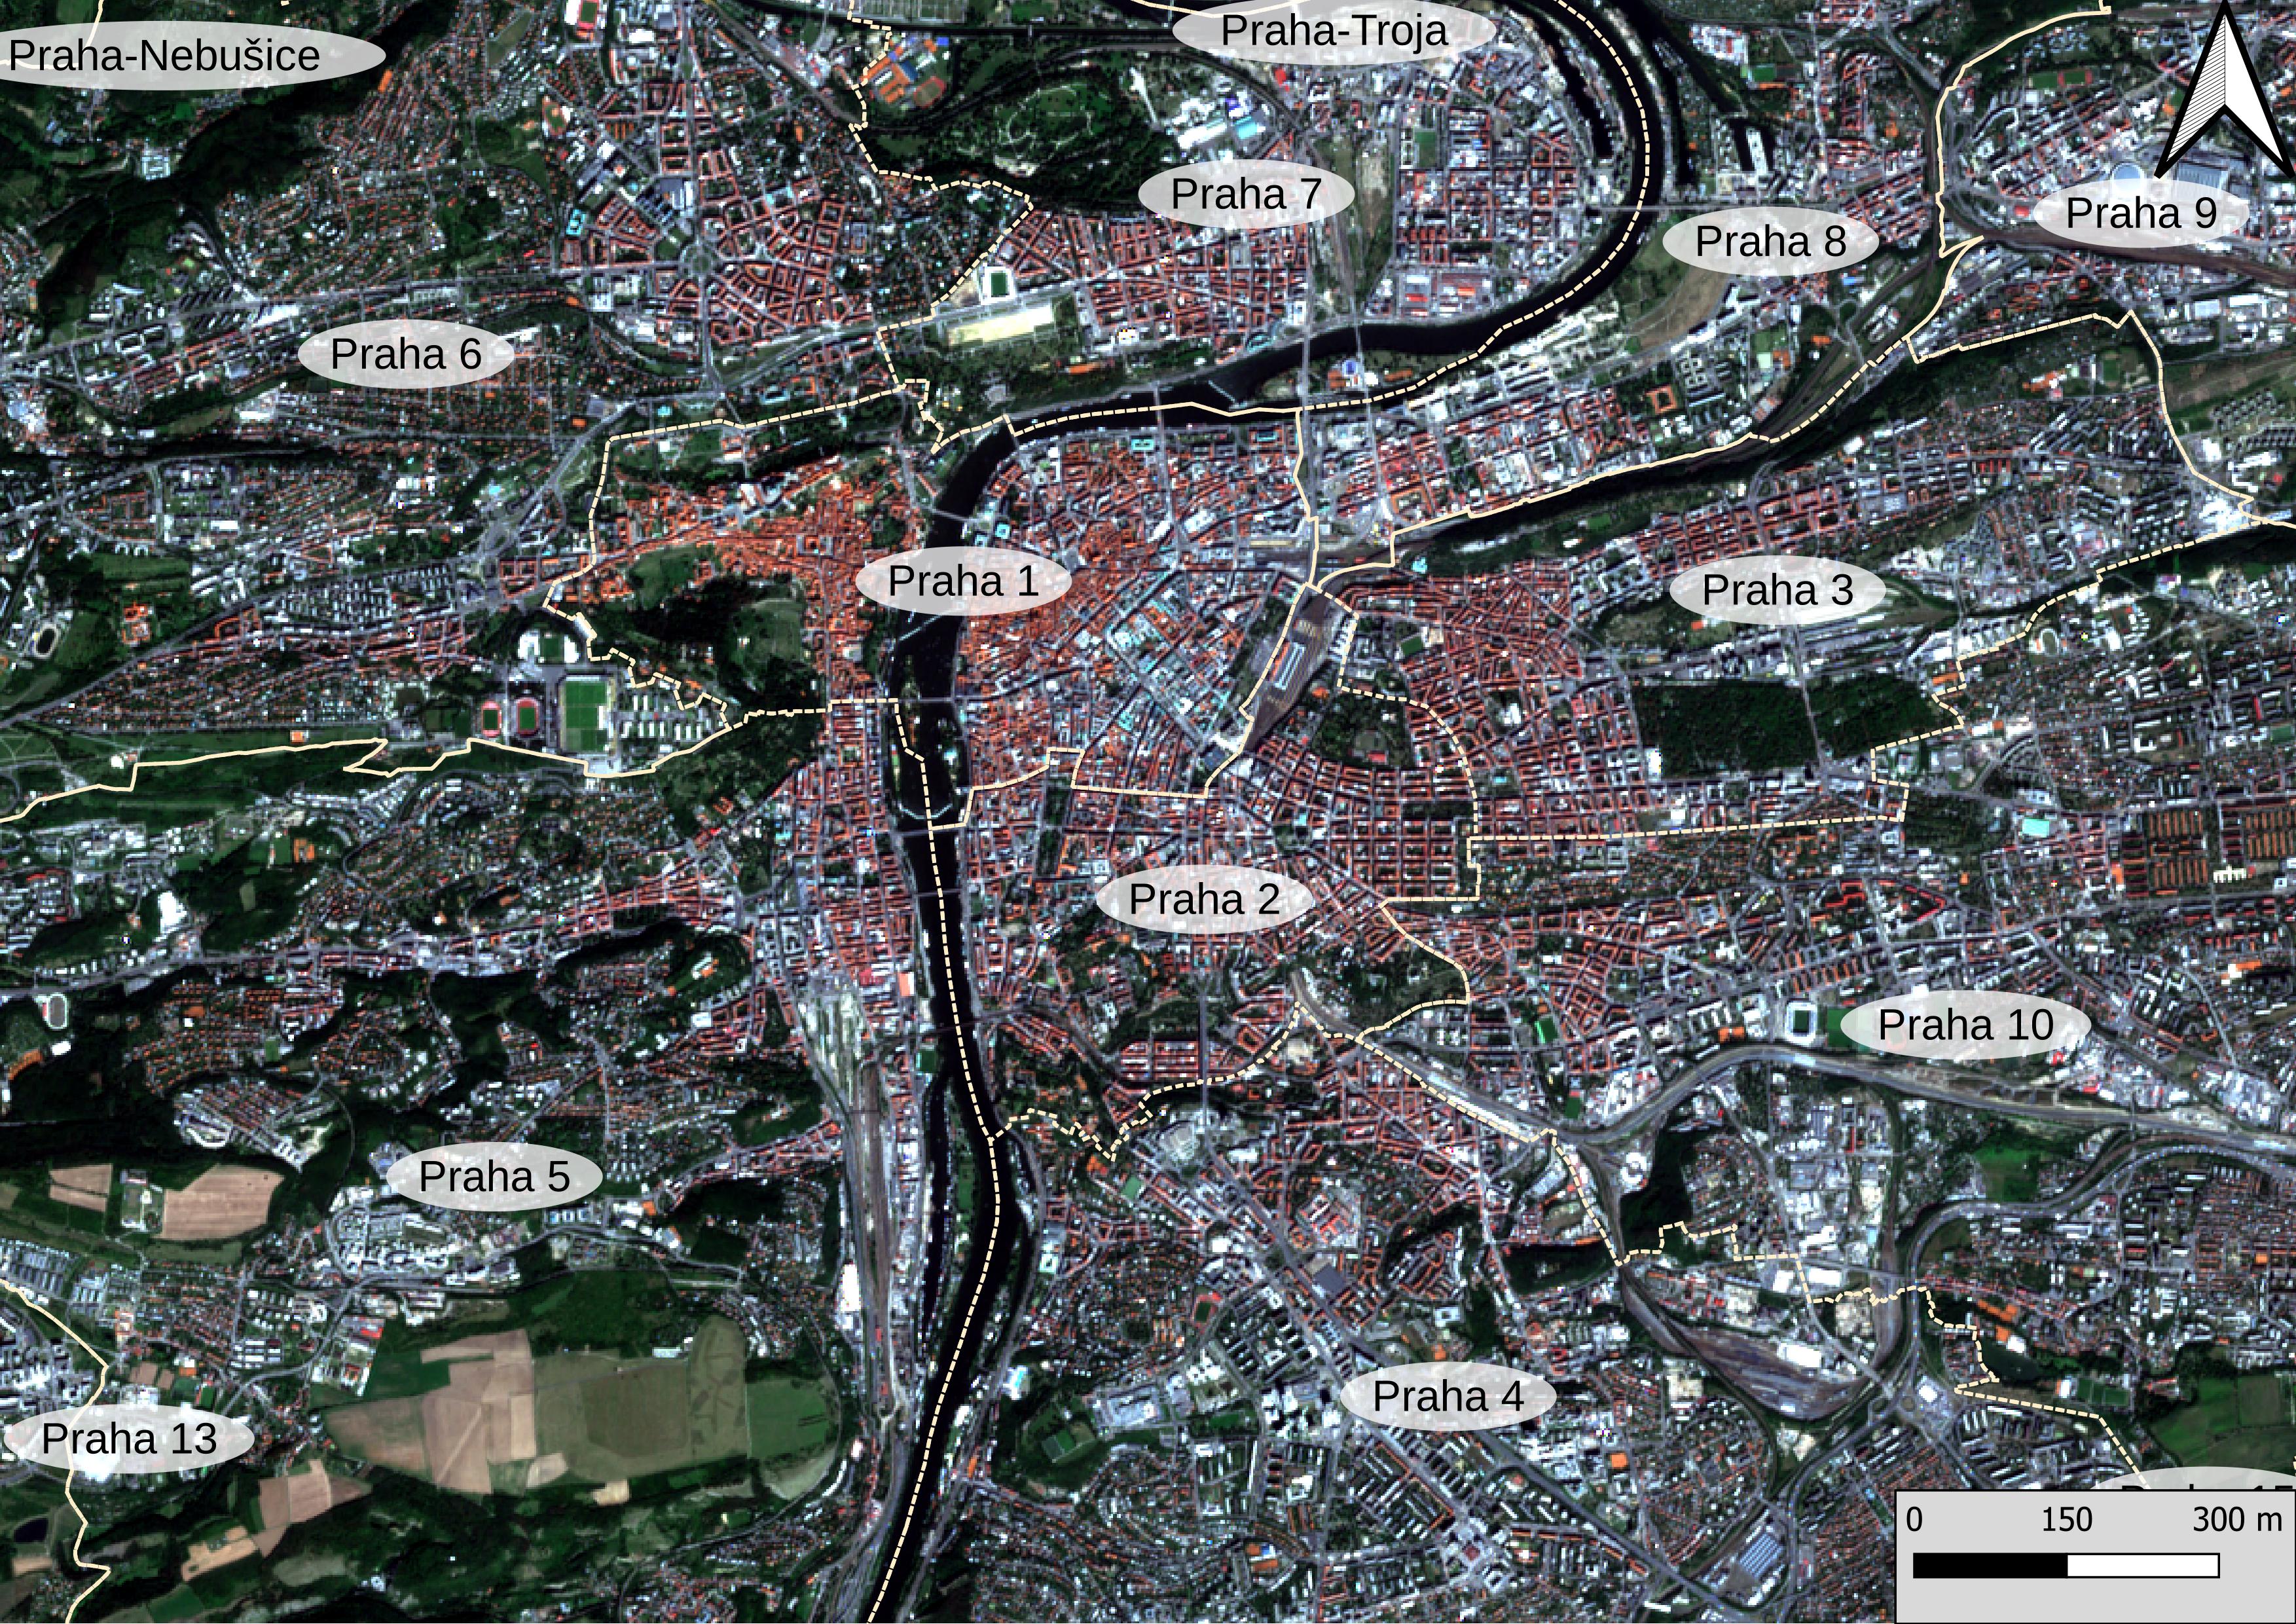
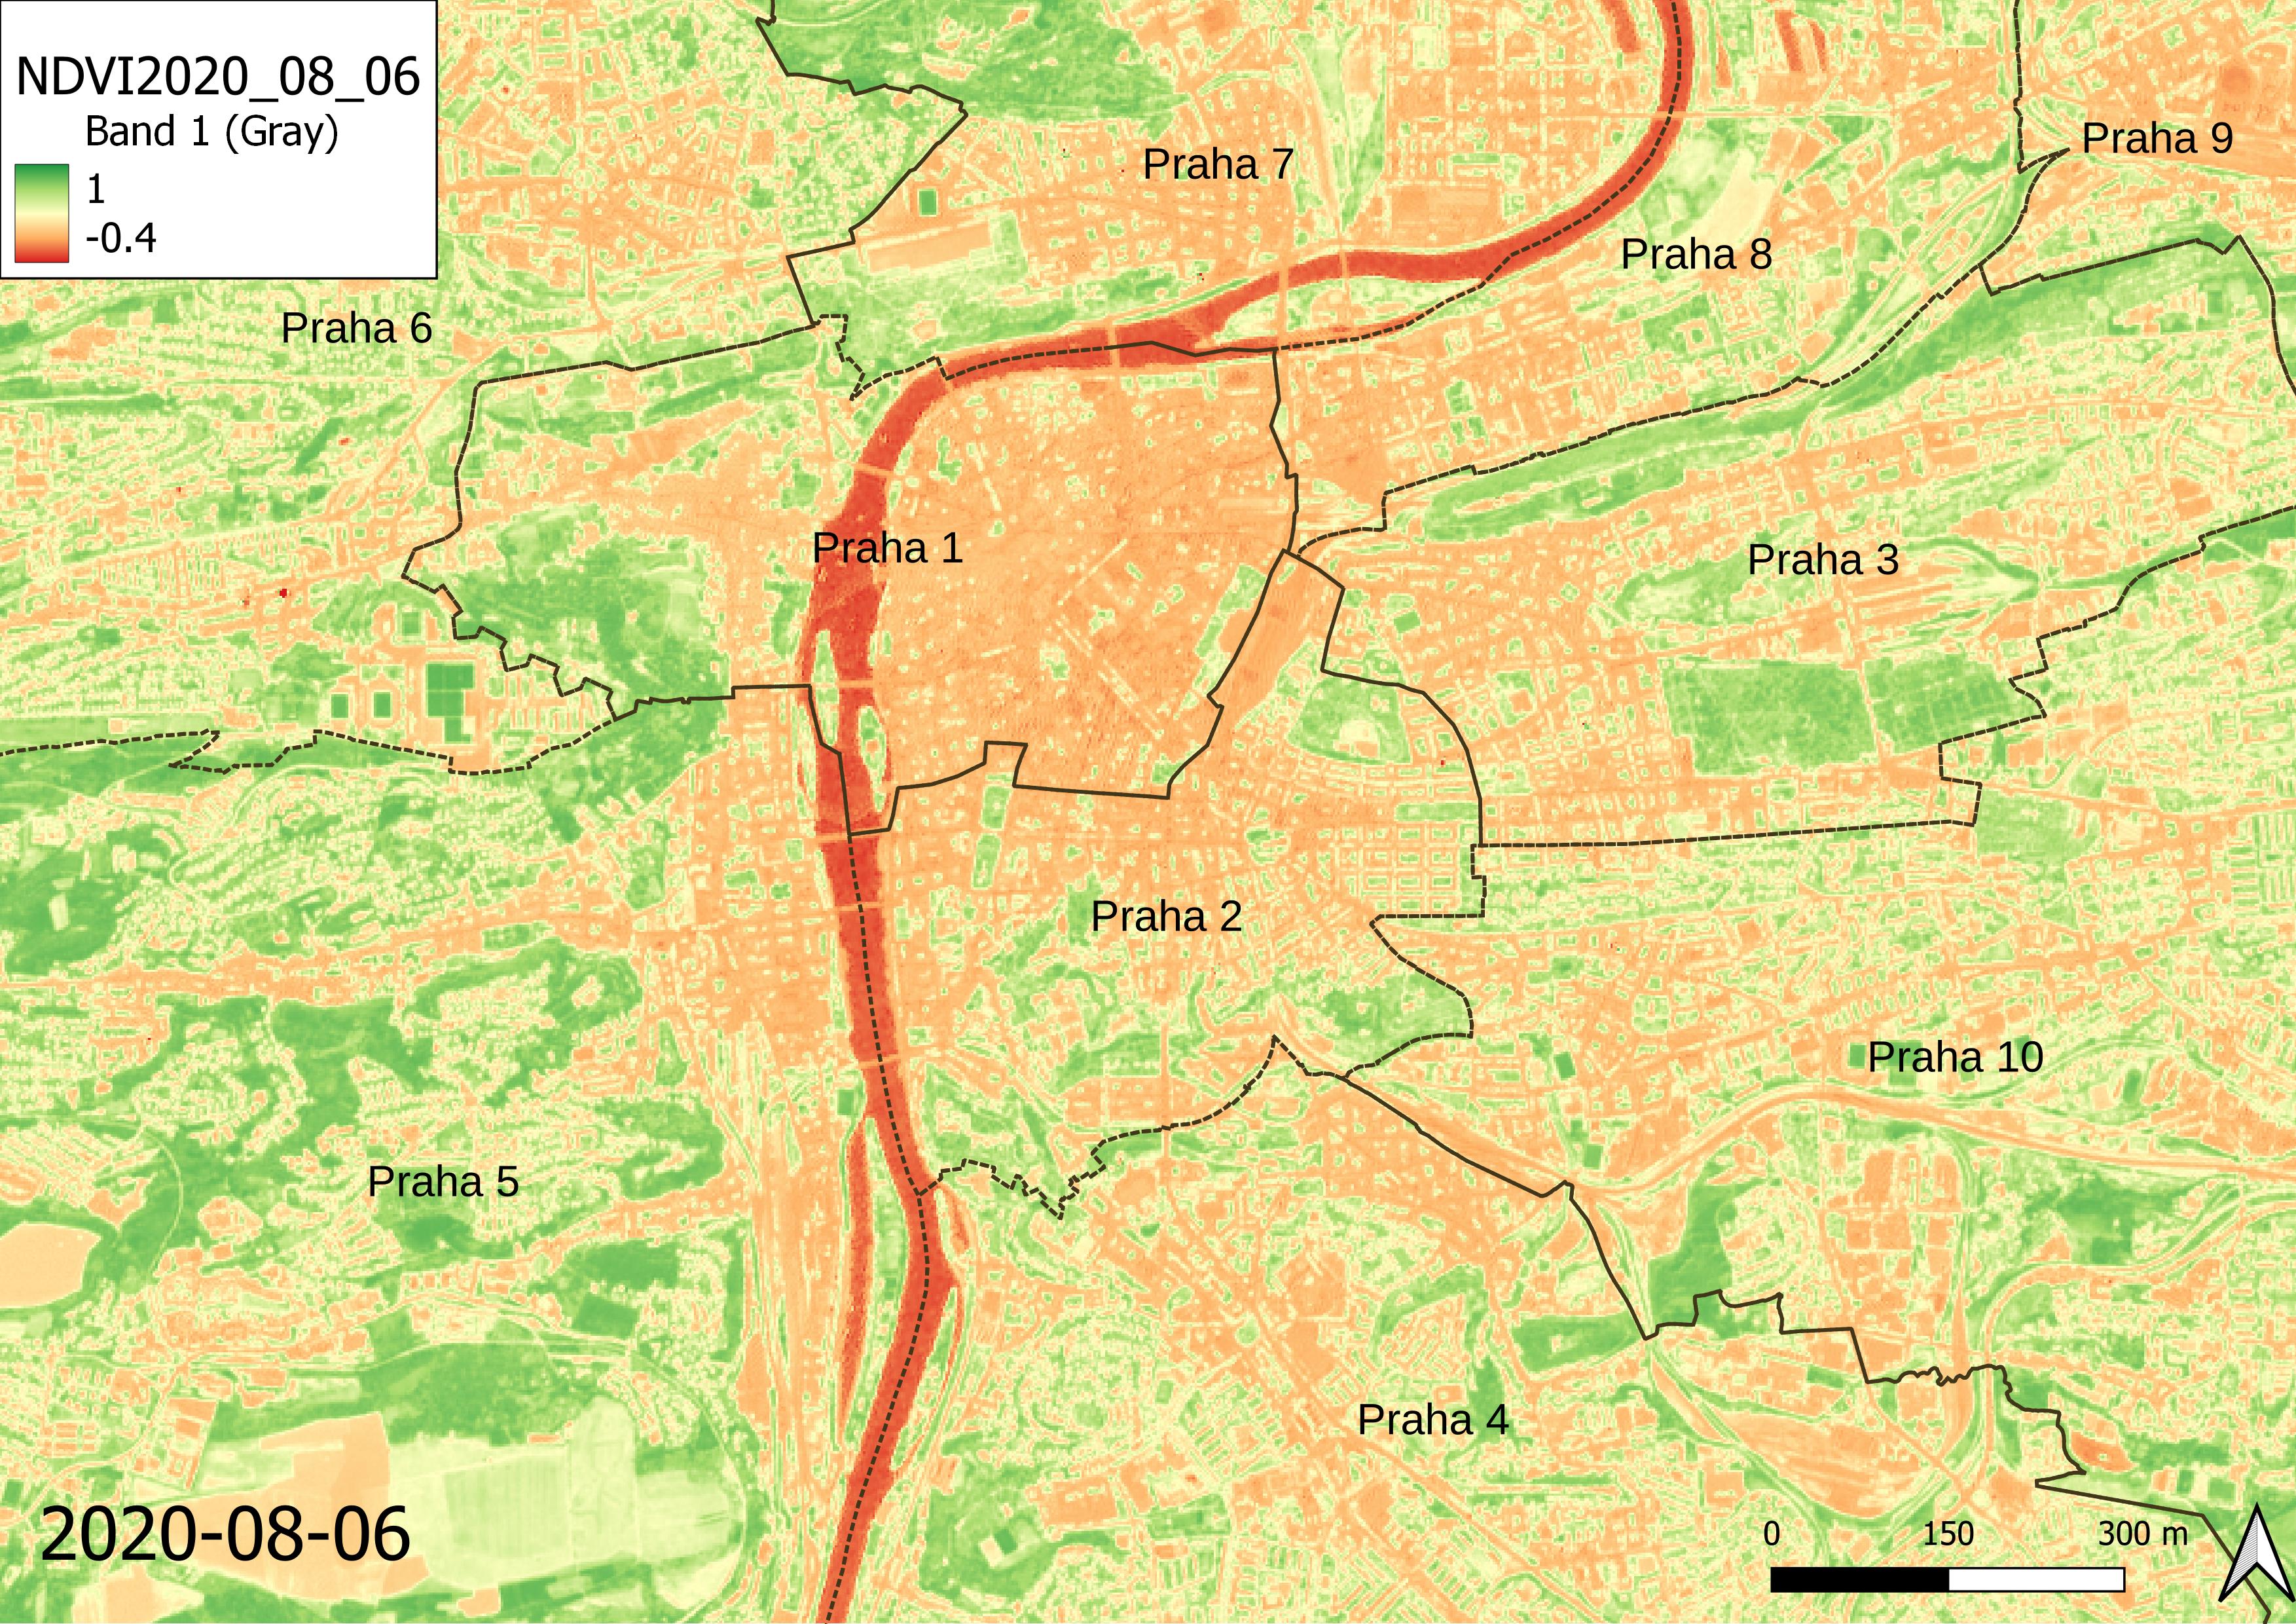
Shapefile of the municipality districts of Prague city.
Cloud-free Sentinel-2 satellite imagery from 2020 to 2021. The easiest approach for processing is likely the Semi-Automatic Classification Plugin for QGIS, developed by Luca Congedo.
Note: Sentinel-2 images were downloaded for the summer period (June to August) from 2015 to 2021. In most cases, only a single cloud-free image was available per year.
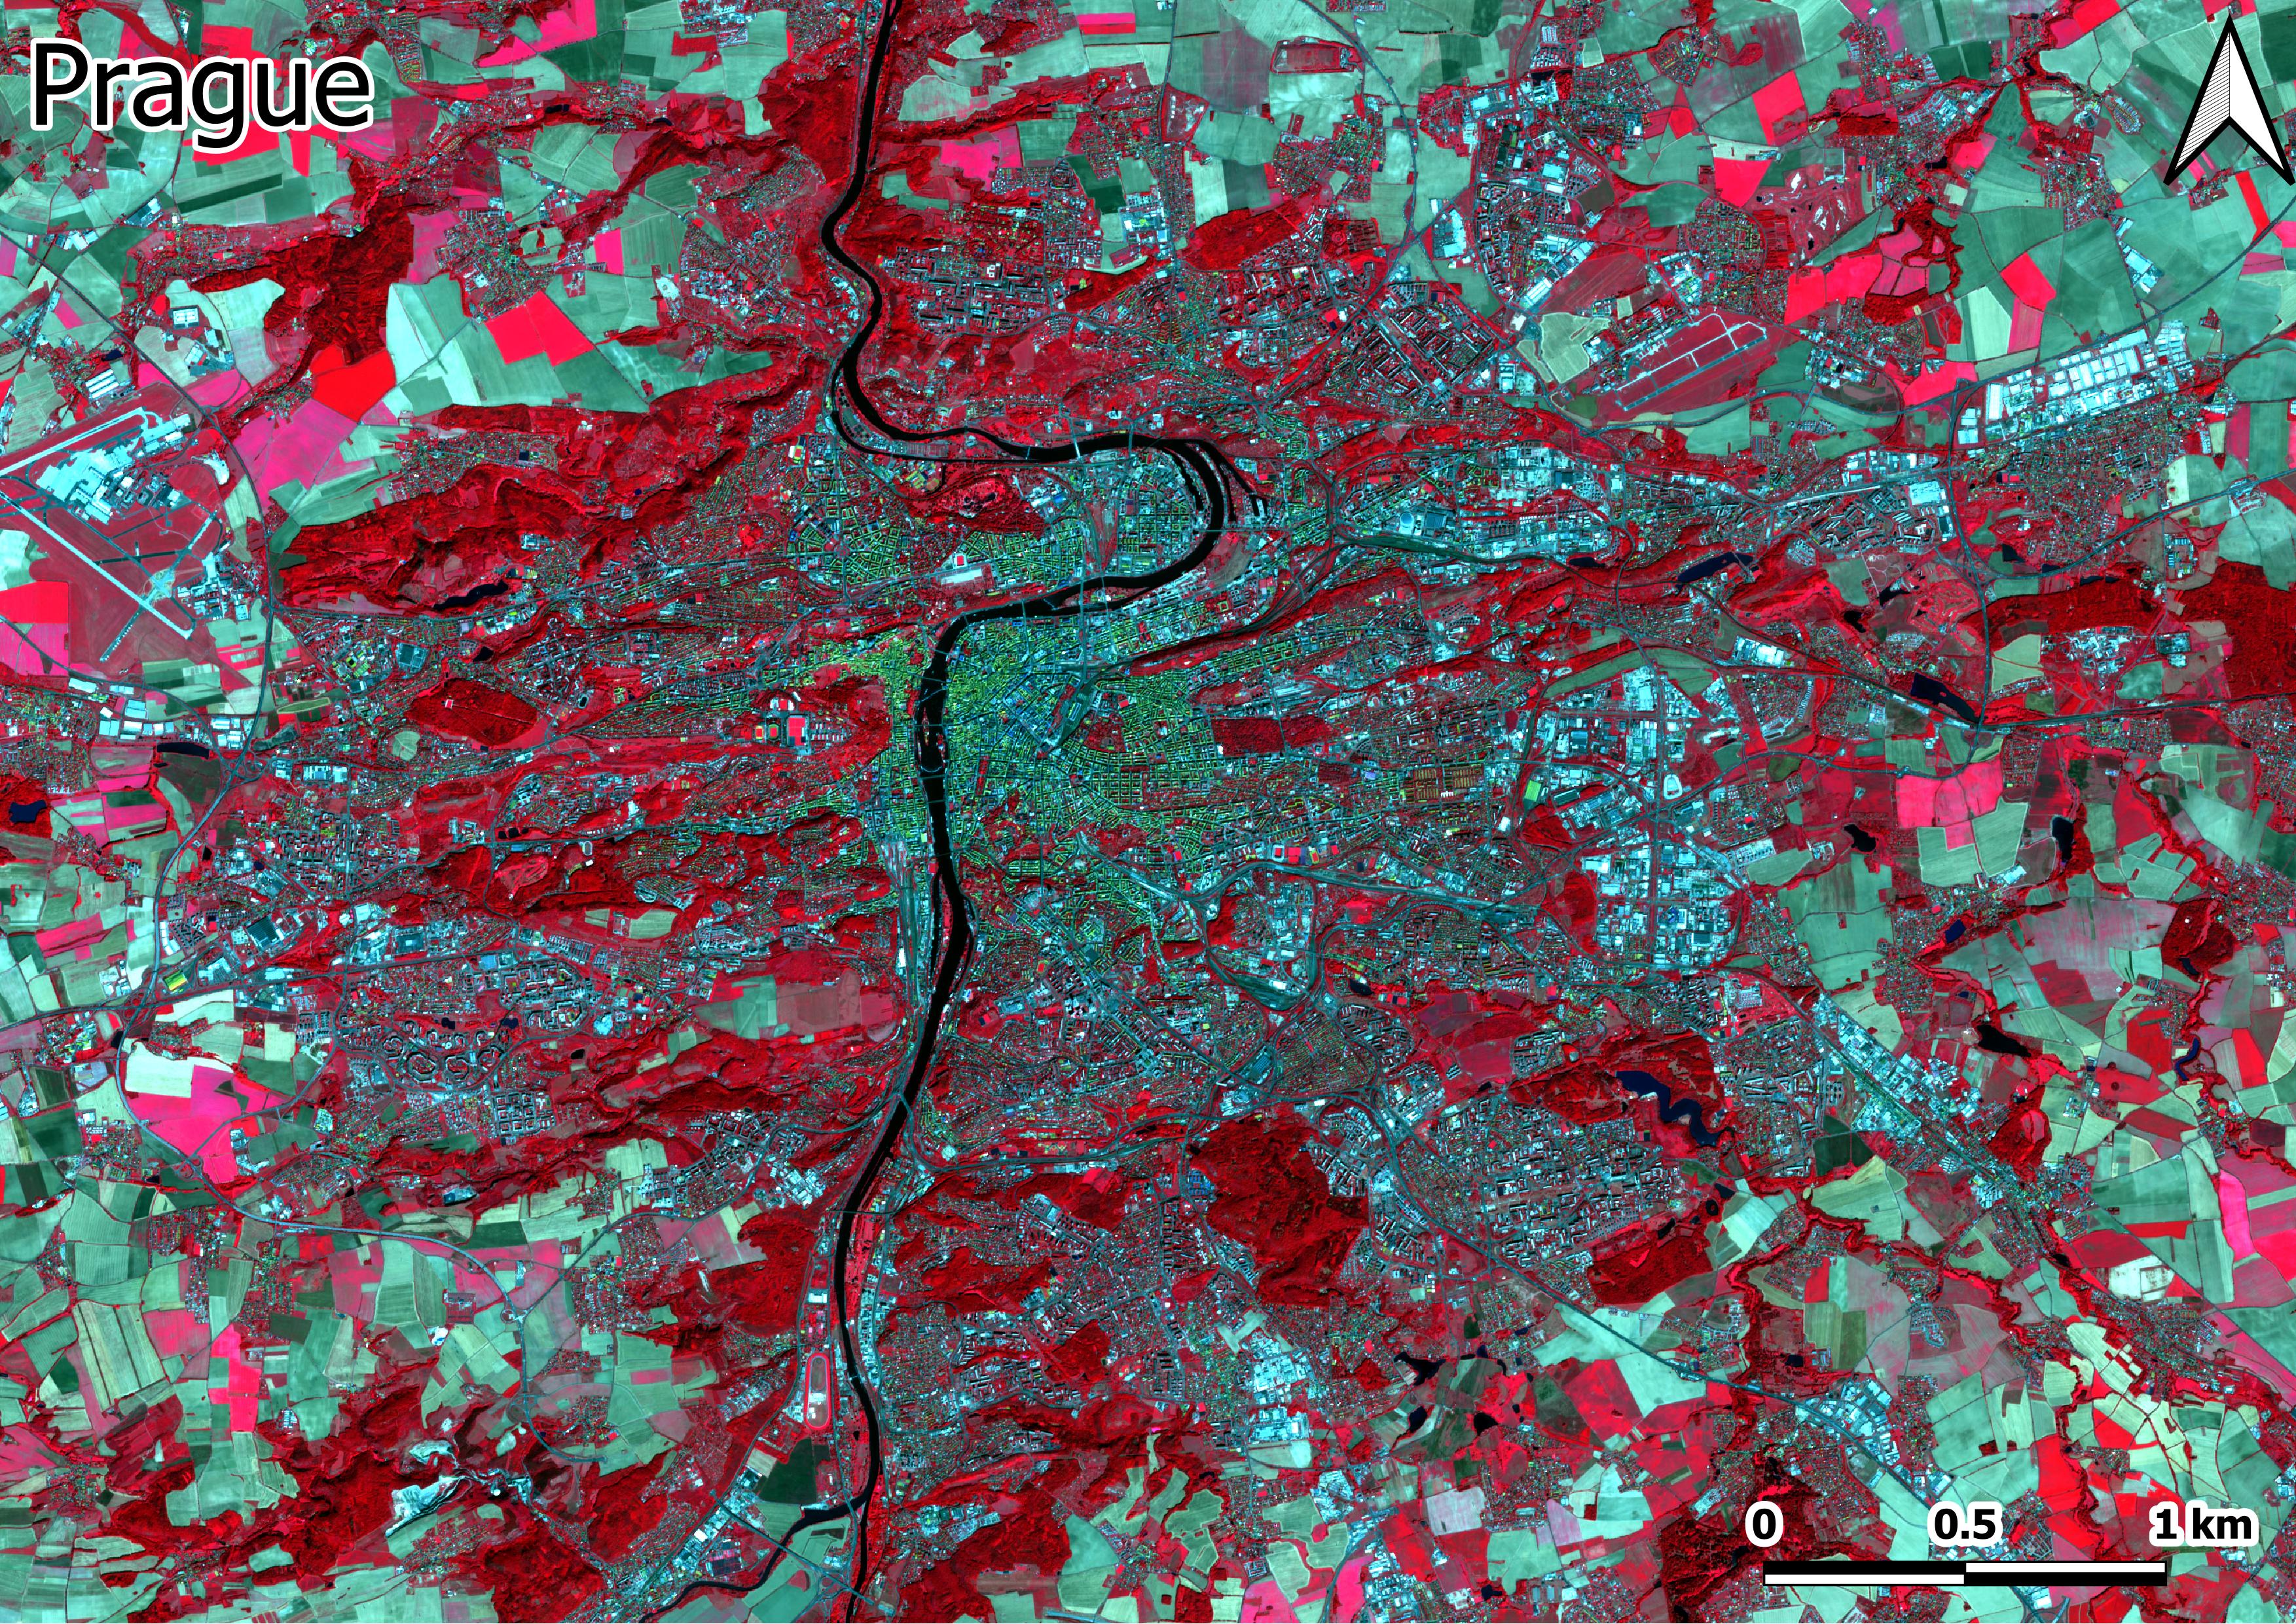
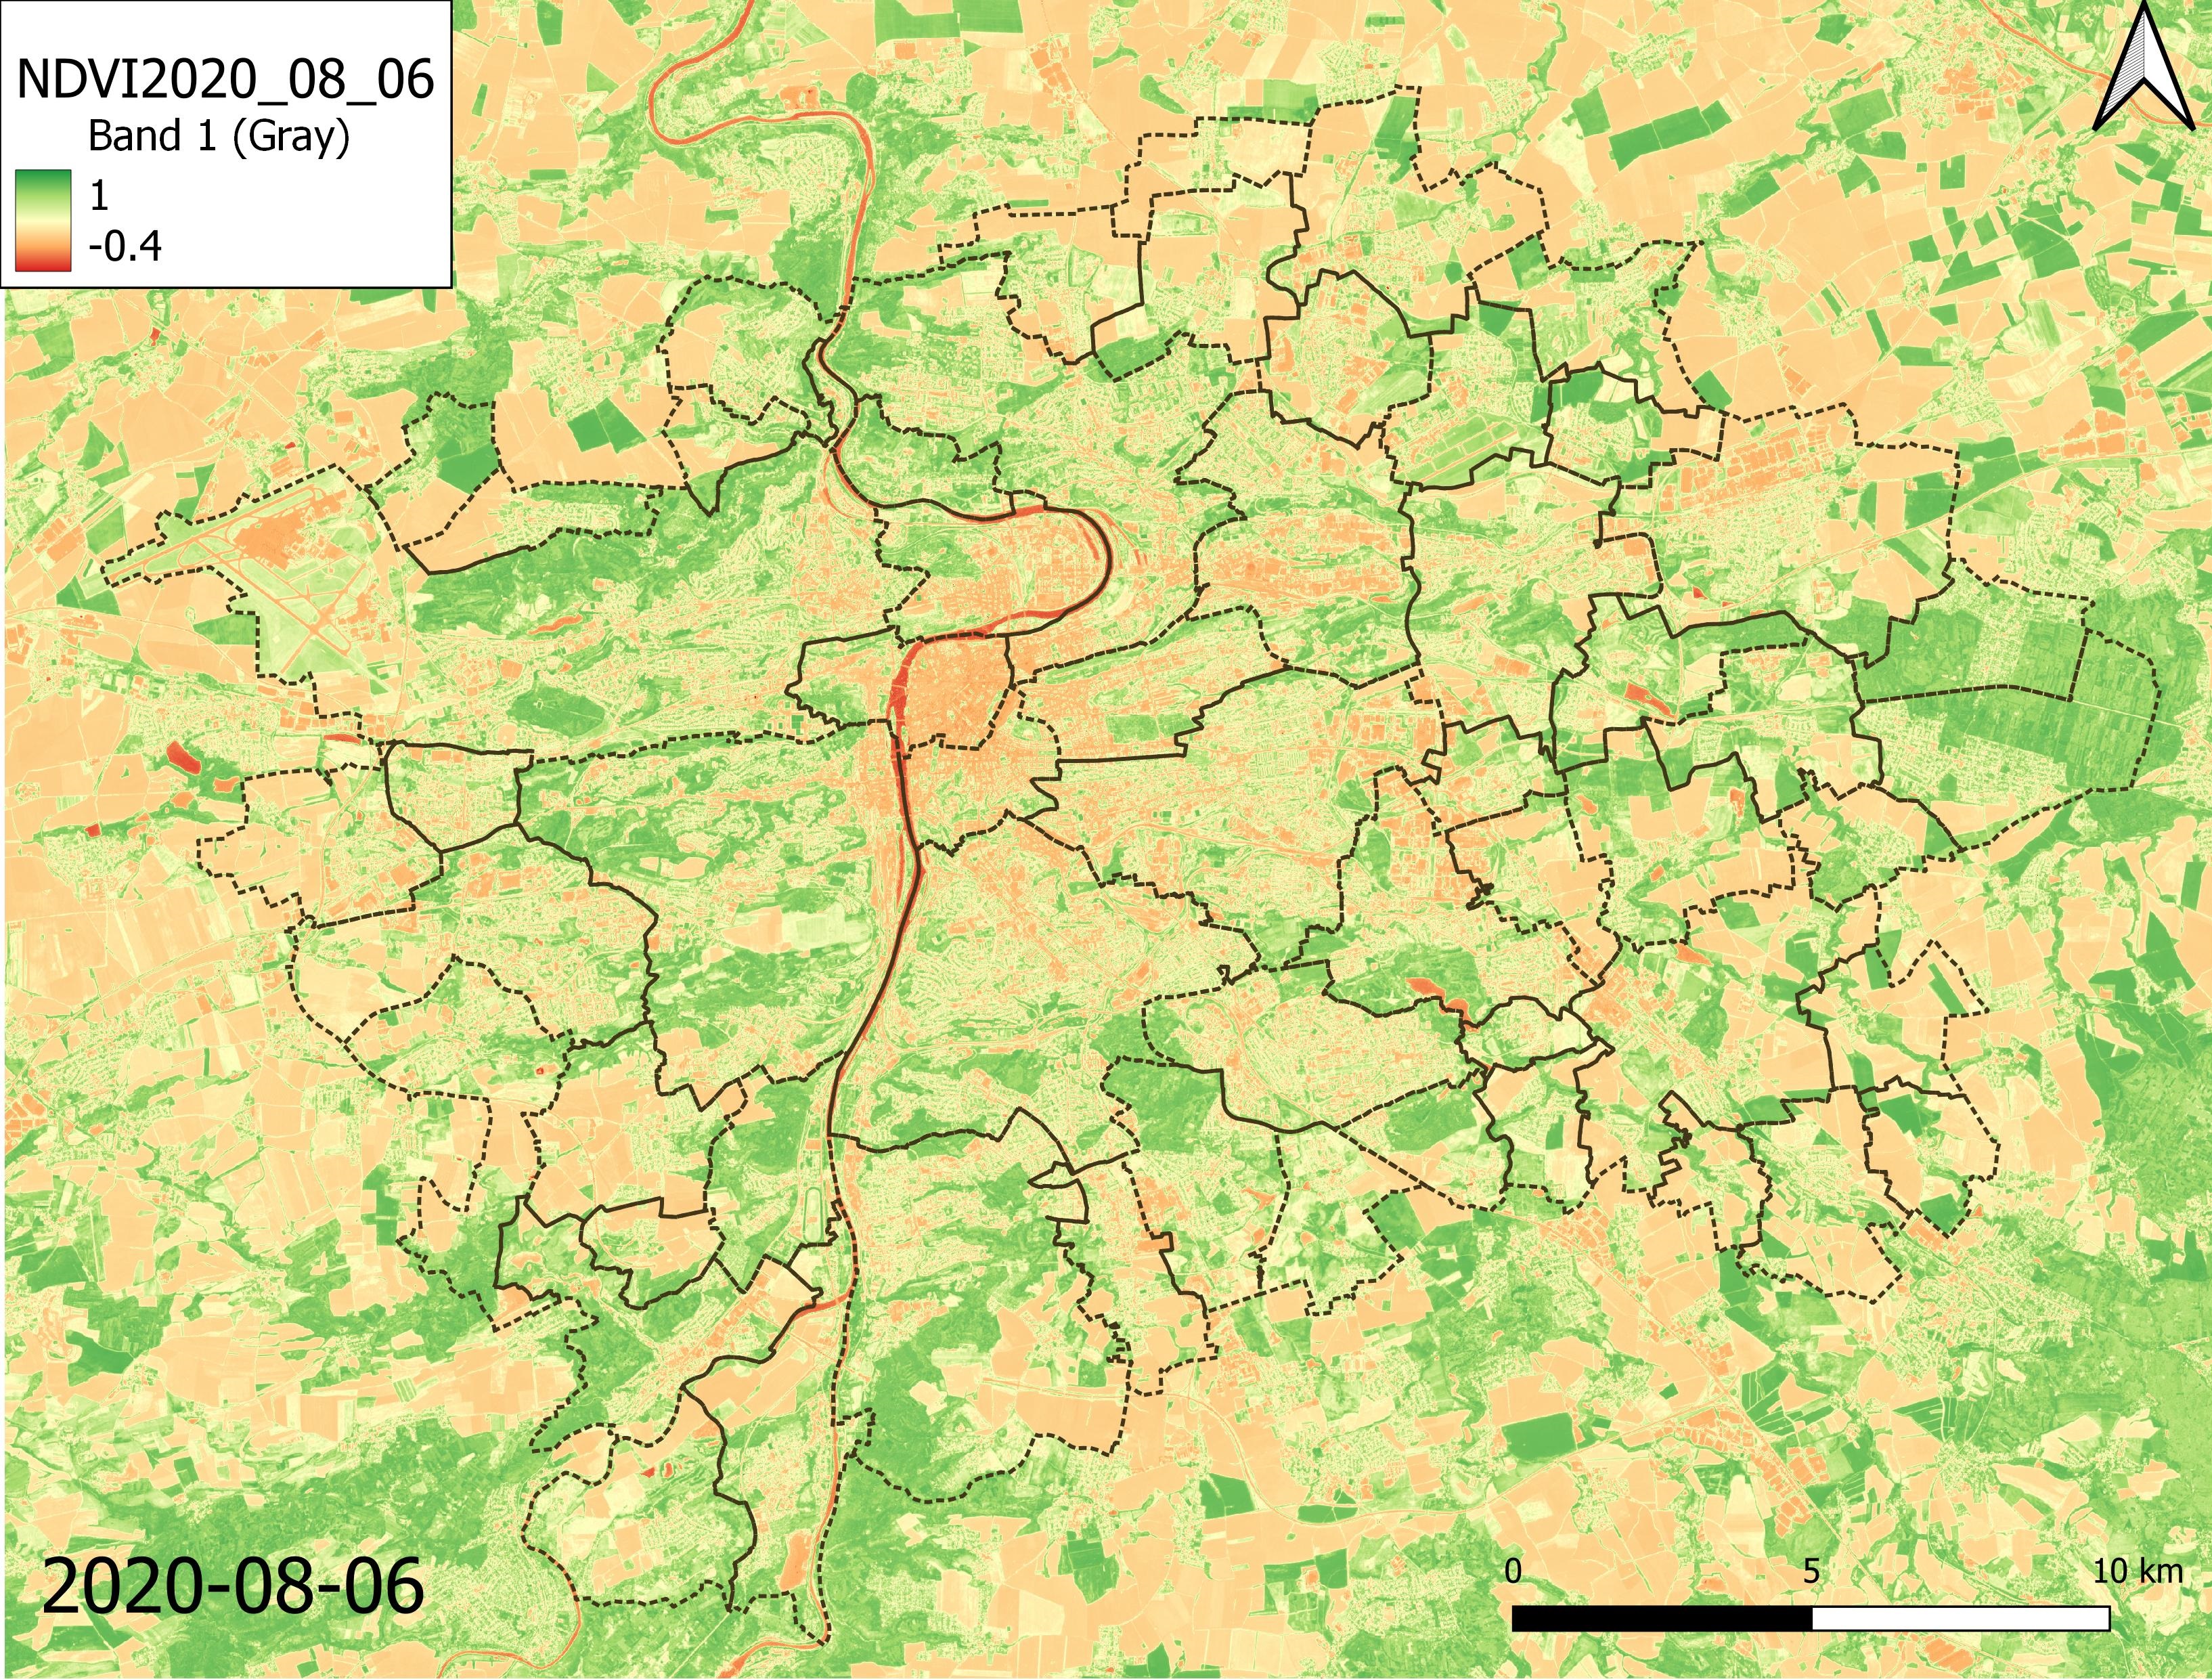
2.) Calculate NDVI
Equation for NDVI goes as: NDVI = (NIR-RED) / (NIR+RED).
These refers to: NDVI = (B8 - B4) / (B8 + B4) of Sentinel-2.
In my case, this was done using the Raster Calculator in QGIS.
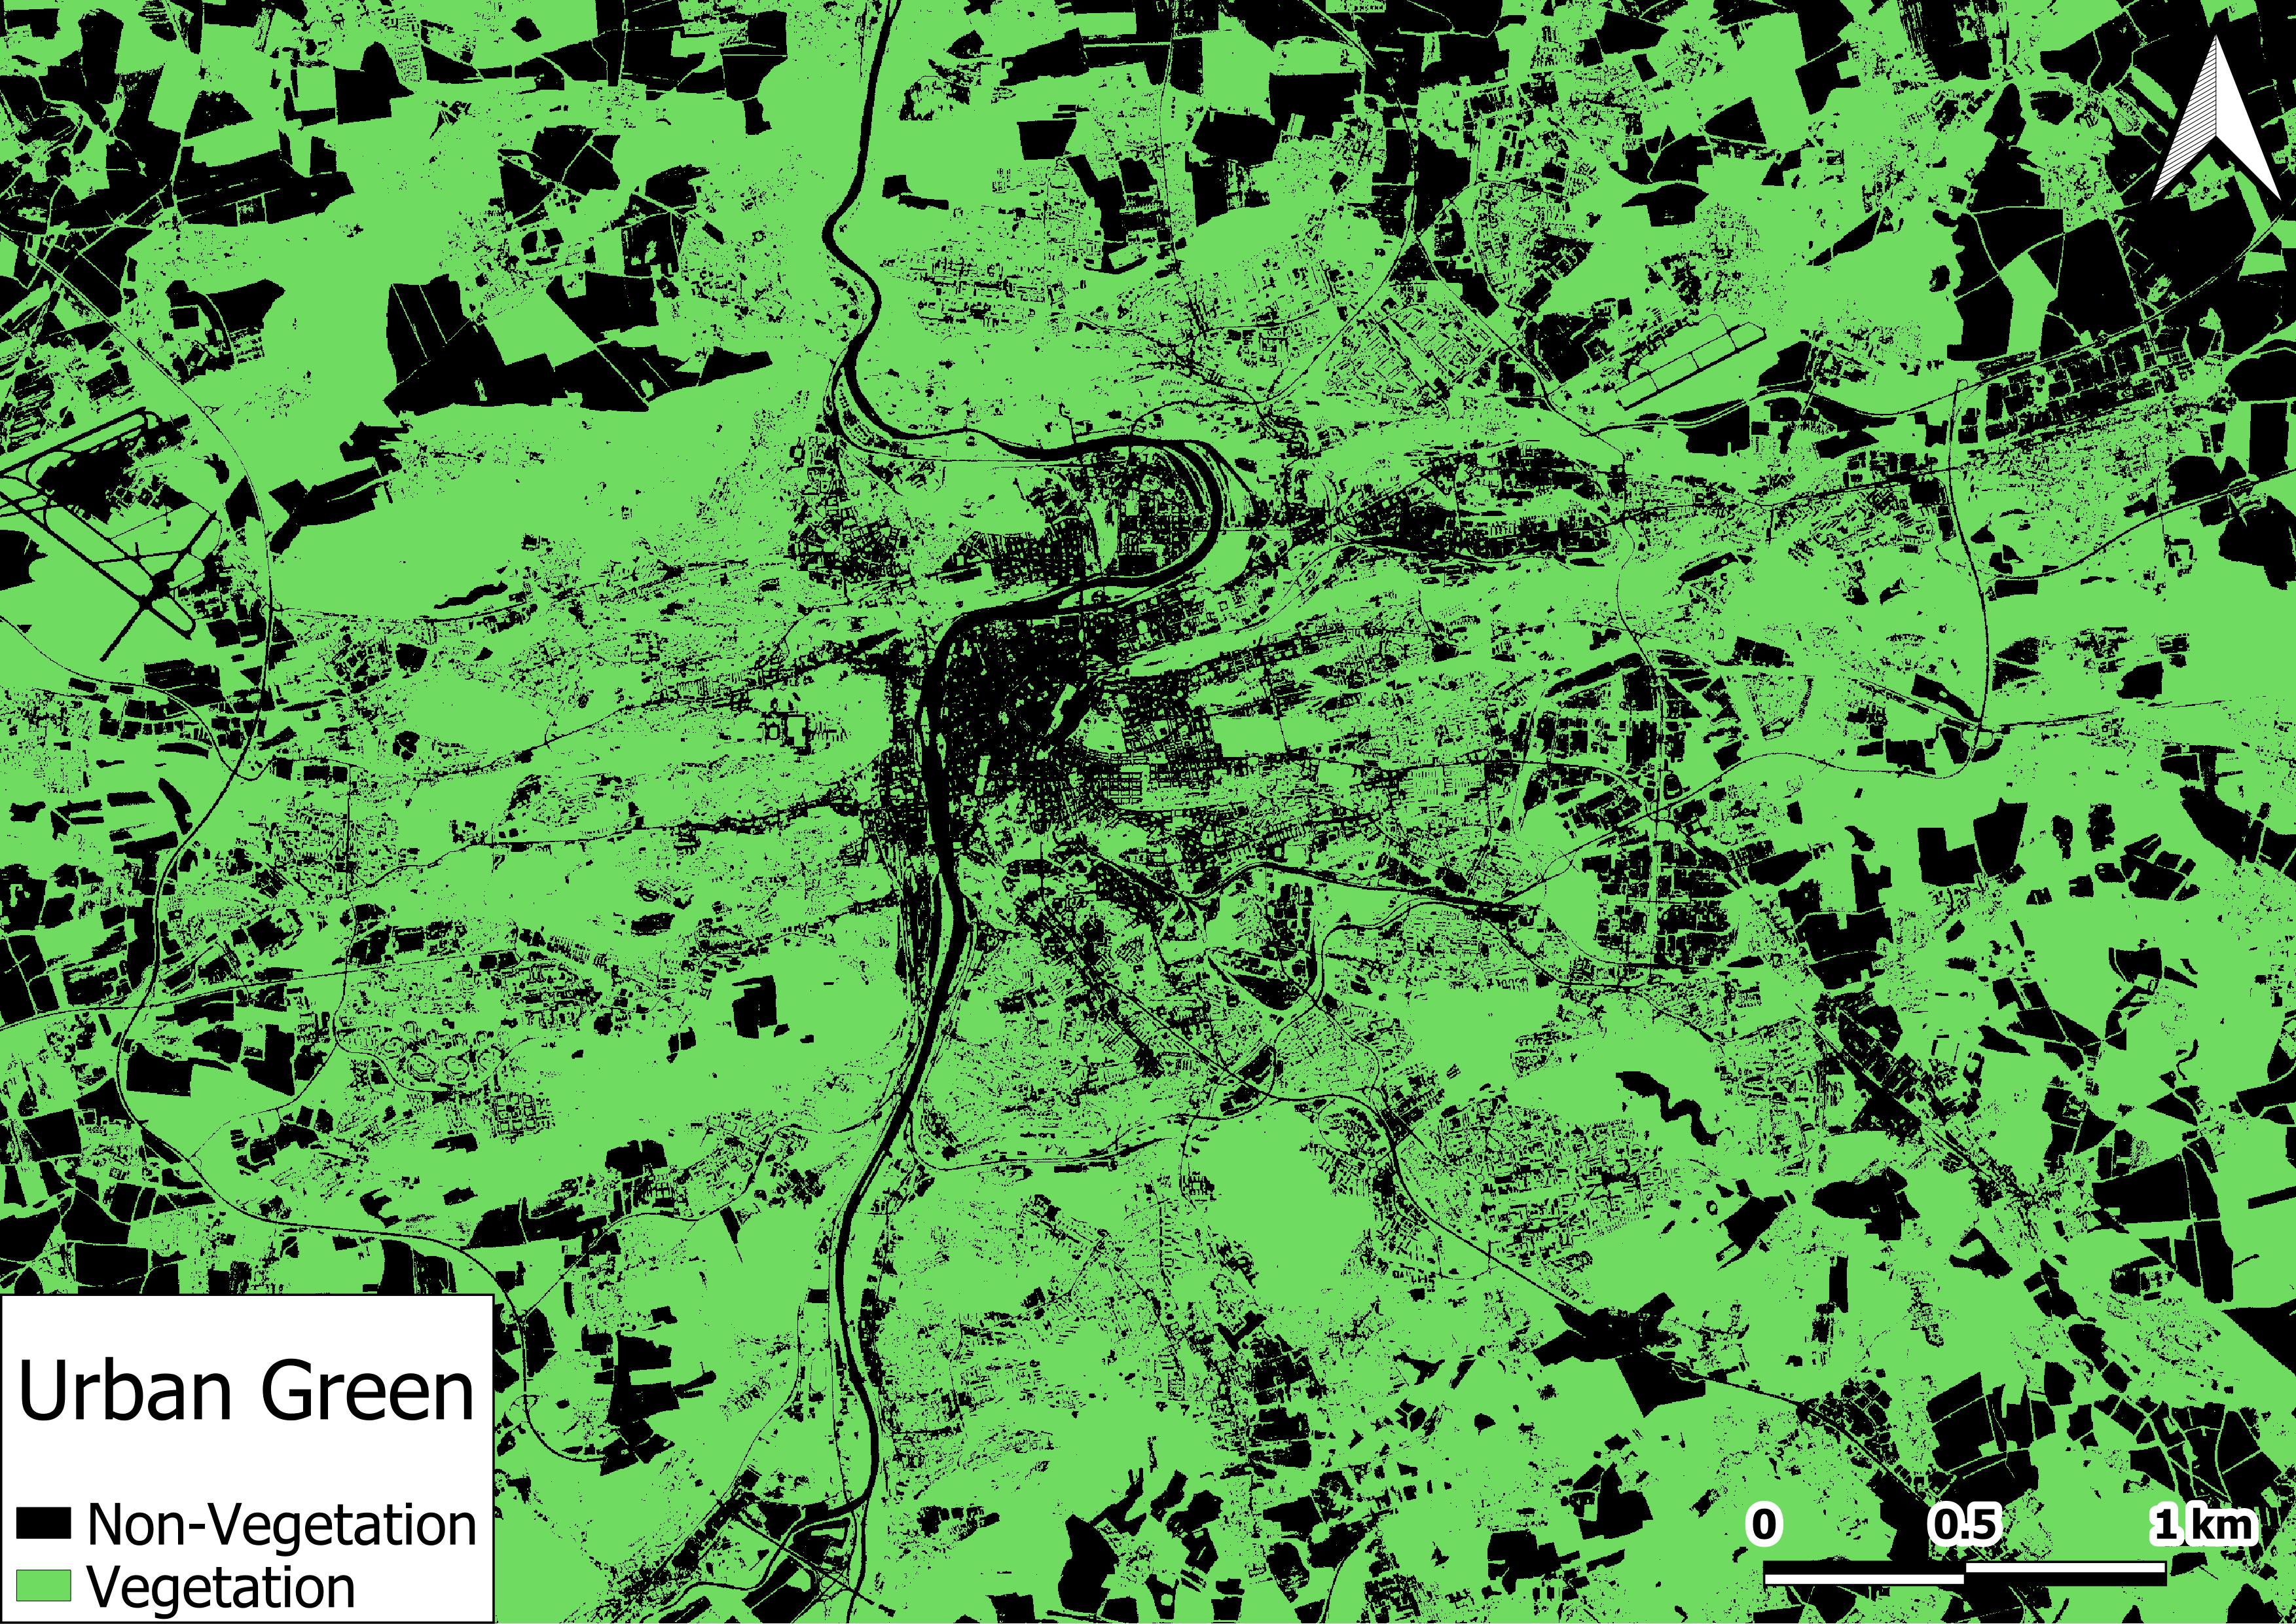
3.) Divide image to non-vegetation and vegetation
I used the Raster Calculator with conditional statements, classifying pixels with NDVI > 0.19 as vegetation and NDVI ≤ 0.19 as non-vegetation.
4.) Calculate the percentage of urban green areas in each municipal district.
There are several approaches to accomplish this task. I used zonal statistics, summing raster values within each polygon.
Finally, the percentage of vegetation was calculated by dividing the sum of vegetation pixels by the total number of pixels in the polygon.

Next, I examined how vegetation in the Prague city centre has changed since 2015.
Overall, there was a positive trend in vegetation development. However, this analysis also highlighted seasonal variations during the summer months associated with wet and dry periods. The drop in 2020 was likely caused by an unusually dry summer, which led to low vegetation (grass and shrubs) dying or exhibiting very low NDVI values.

Note:
The results of this project should not be interpreted as absolute truth; further analysis is always necessary.
It is also possible to focus specifically on detecting trees, which would allow for a more accurate analysis in the future.